How to Create a Real-Time Dashboard With Scheduled Refresh
November 3, 2026 · 13 min read
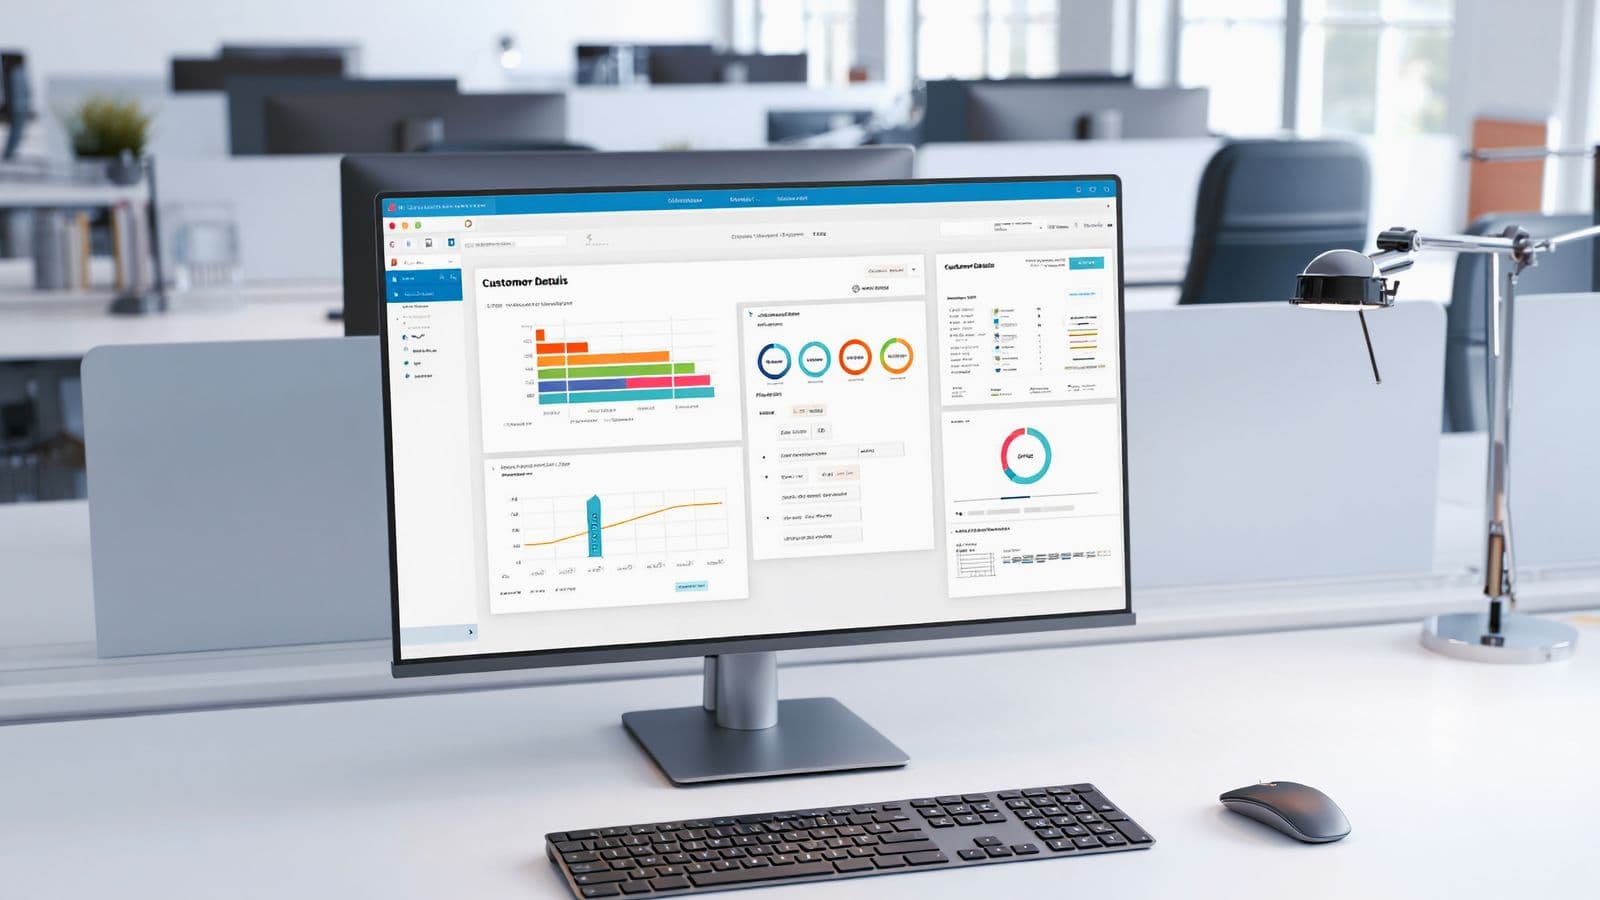
A real-time dashboard helps businesses monitor important information without manually checking reports or refreshing data throughout the day. Whether you are tracking website traffic, sales performance, marketing campaigns, customer activity, or operational metrics, a dashboard with scheduled refresh can make data easier to understand and act on.
However, creating a useful dashboard involves more than adding charts and setting a refresh interval. You need to choose the right data sources, define how frequently information should update, organize metrics, and make sure the dashboard displays reliable data.
This guide explains how to create a real-time dashboard with scheduled refresh, which tools you can use, how refresh intervals work, and how to troubleshoot common problems.
What Is a Real-Time Dashboard With Scheduled Refresh?
A real-time dashboard is a visual interface that displays information from connected data sources and updates as new data becomes available.
A scheduled refresh automatically updates the dashboard at predefined intervals. Instead of manually refreshing reports, users can configure the system to retrieve or display updated information every few seconds, minutes, or hours.
For example, a marketing dashboard might display:
- Website traffic and visitor activity
- Google Ads and social media campaign performance
- Conversion rates and revenue
- Customer acquisition costs
- Sales and lead generation metrics
When the dashboard refreshes, its charts, tables, and KPI cards can reflect the latest available data.
It is important to understand that scheduled refresh does not always mean true real-time data. The dashboard may update every minute while the underlying data source updates every 15 minutes or once per hour.
Real-Time Dashboard vs. Scheduled Dashboard Refresh
These terms are related, but they describe different update methods.
Real-Time Data Updates
Real-time dashboards receive or process new information as events occur. Depending on the system, they may use streaming data, WebSockets, event-driven updates, or frequent polling.
This approach is useful when users need to monitor rapidly changing information, such as system activity, live transactions, or operational events.
Scheduled Data Refresh
Scheduled refresh updates data at predefined intervals.
For example, a dashboard might refresh every five minutes or every hour. This approach works well when the data does not need to change continuously.
Automatic Browser Refresh
Automatic browser refresh reloads the webpage or dashboard at a specific interval.
This can help users view updated dashboard content without manually reloading the page. However, refreshing the browser does not necessarily retrieve new data from the database or reporting system.
For a dashboard to show updated information, its data source and application must also support updates.
Step 1: Define the Purpose of Your Dashboard
Before building your dashboard, determine what information users need to monitor.
A dashboard should answer specific business questions rather than display every available metric.
For example:
Marketing Dashboard
A marketing dashboard may track website visitors, campaign performance, conversion rates, cost per lead, and advertising return.
Sales Dashboard
A sales dashboard may display total revenue, sales pipeline, completed orders, average order value, and daily sales performance.
Website Monitoring Dashboard
A website monitoring dashboard may display website availability, response time, traffic, error rates, and page performance.
Operations Dashboard
An operations dashboard may track task completion, inventory, service activity, system performance, and operational delays.
Choose the metrics that support your dashboard’s purpose. Too many unrelated metrics can make it difficult for users to identify important changes.
Step 2: Choose a Dashboard Tool
The right dashboard platform depends on your data sources, technical requirements, budget, and preferred refresh method.
Microsoft Power BI
Power BI is useful for business reporting, analytics, and dashboards connected to databases, spreadsheets, cloud services, and other supported sources.
It supports scheduled data refresh for applicable datasets and provides options for connecting to different data systems.
Power BI is a suitable choice for organizations that need business intelligence dashboards with reporting and data analysis features.
Tableau
Tableau provides data visualization and dashboard-building capabilities for business analytics.
It can connect to supported data sources and use refresh schedules depending on the connection type, deployment, and configuration.
Tableau is useful for creating interactive dashboards with charts, filters, and business performance reports.
Looker Studio
Looker Studio is commonly used for marketing, website analytics, and business reporting.
It can connect to supported data sources and display metrics in interactive reports. Data freshness depends on the connector, source, and configuration.
It is a practical option for dashboards involving website traffic, advertising performance, and marketing reporting.
Custom Dashboard With Python
Developers can build custom dashboards using Python frameworks such as Dash.
Dash supports interactive charts and scheduled updates through components such as dcc.Interval. Its interval property can trigger callbacks that update dashboard components.
For example, a dashboard can retrieve new information and update a graph every 60 seconds.
This method provides more flexibility when you need custom data processing, application logic, or a specialized interface.
Step 3: Connect Your Data Sources
After choosing a dashboard platform, connect it to the information you want to display.
Common data sources include:
- SQL databases
- Excel and CSV files
- Google Analytics
- Advertising platforms
- CRM systems
- APIs
- Cloud data warehouses
- Website monitoring tools
The connection method depends on the platform and the source.
For example, a dashboard connected to a database may retrieve information through a query. A marketing dashboard may use an analytics connector. A custom application may retrieve information through an API.
Check Data Quality Before Creating Charts
Before building visualizations, make sure the connected data is accurate and consistent.
Check for:
- Missing values
- Duplicate records
- Incorrect timestamps
- Inconsistent date formats
- Delayed source updates
- Incorrect calculations
A dashboard can refresh successfully while displaying incorrect information if the underlying data is not reliable.
Step 4: Design the Dashboard Layout
A useful dashboard should make important information easy to identify.
Start with the most important metrics and organize supporting information underneath them.
Add KPI Cards
KPI cards display important values such as total sales, active users, conversion rate, or website uptime.
These cards help users understand current performance without reading a detailed report.
Add Charts
Choose chart types based on the information you want to communicate.
Use line charts to display changes over time.
Use bar charts to compare categories.
Use tables when users need detailed records.
Use gauges or progress indicators when tracking performance against a target.
Add Filters
Filters allow users to view information by date, campaign, location, product, or another relevant category.
For example, a marketing dashboard might allow users to select a campaign and compare its performance with other campaigns.
Keep the layout simple. A dashboard should help users understand information quickly instead of making them search through multiple sections.
Step 5: Configure the Scheduled Refresh Interval
The refresh interval determines how frequently the dashboard attempts to update.
The correct interval depends on how quickly the source data changes and how frequently users need updated information.
Example Refresh Schedule
| Dashboard Type | Example Refresh Interval |
|---|---|
| Live operational monitoring | Seconds to minutes |
| Website analytics | 5 to 15 minutes |
| Marketing performance | 15 to 60 minutes |
| Sales reporting | 15 minutes to several hours |
| Daily business reports | Once or several times per day |
These are example intervals, not universal requirements. Actual refresh frequency depends on the dashboard platform, data source, available limits, and business needs.
Refreshing too frequently can increase database load, API usage, and processing costs.
Refreshing too slowly can make information less useful for users who need current data.
Scheduled Refresh in Power BI
In Power BI, scheduled refresh settings depend on the dataset, connection type, workspace configuration, and available capacity.
A typical setup involves:
- Open the relevant workspace.
- Select the semantic model or dataset.
- Open its refresh settings.
- Configure the refresh schedule and time zone.
- Set the required credentials.
- Save the schedule.
- Test the refresh and review its status.
Some connections support different refresh methods, and applicable refresh limits vary by licensing and configuration.
Scheduled Refresh in Tableau
In Tableau, refresh configuration depends on whether the data source uses an extract or a live connection and where the dashboard is hosted.
For supported extracts, users can configure refresh schedules through the relevant Tableau environment.
A live connection may query the underlying source when the dashboard loads or when users interact with it. This does not necessarily mean that the database itself receives new information continuously.
Check the connection type and refresh configuration before assuming the dashboard is displaying the latest source data.
Step 6: Build a Dashboard With Automatic Updates Using Python Dash
Python Dash is one option for creating a custom dashboard with scheduled updates.
Dash provides an interval component that triggers callbacks after a specified number of milliseconds.
The following example demonstrates a basic dashboard that updates a chart every 60 seconds.
Install the Required Packages
Run the following command:
pip install dash plotly pandasCreate the Dashboard
Create a Python file named app.py.
from dash import Dash, dcc, html, Input, Output
import plotly.express as px
import pandas as pd
from datetime import datetime

app = Dash(__name__)

def get_data():
    # Replace this sample data with your database or API.
    return pd.DataFrame({
        "time": [
            datetime.now().strftime("%H:%M:%S"),
            datetime.now().strftime("%H:%M:%S"),
            datetime.now().strftime("%H:%M:%S")
        ],
        "sales": [120, 180, 150]
    })

app.layout = html.Div([
    html.H1("Real-Time Sales Dashboard"),

    html.Div(id="last-updated"),

    dcc.Graph(id="sales-chart"),

    dcc.Interval(
        id="refresh-interval",
        interval=60 * 1000,
        n_intervals=0
    )
])

@app.callback(
    Output("sales-chart", "figure"),
    Output("last-updated", "children"),
    Input("refresh-interval", "n_intervals")
)
def update_dashboard(n):
    data = get_data()

    figure = px.bar(
        data,
        x="time",
        y="sales",
        title="Sales Performance"
    )

    updated_at = datetime.now().strftime(
        "%Y-%m-%d %H:%M:%S"
    )

    return figure, f"Last updated: {updated_at}"

if __name__ == "__main__":
    app.run(debug=True)
How the Refresh Works
The dcc.Interval component triggers the dashboard callback every 60 seconds.
The callback retrieves data, creates an updated chart, and displays the latest refresh time.
The interval is configured in milliseconds:
interval=60 * 1000This means the callback runs approximately every 60 seconds while the dashboard is active.
The sample data is static, so the chart will not show genuine live business information. Replace the get_data() function with a database query or API request to retrieve updated records.
For production use, also consider API timeouts, error handling, caching, and database connection management.

Step 7: Connect the Dashboard to a Database or API
A real dashboard needs a reliable way to retrieve current information.
Database Connection
If your application uses a SQL database, create a query that retrieves the required metrics.
For example:
SELECT
    DATE(created_at) AS report_date,
    SUM(amount) AS total_sales
FROM orders
GROUP BY DATE(created_at)
ORDER BY report_date;
The dashboard can execute this query during its scheduled update and use the returned results to update its charts.
Make sure the database query is optimized and does not retrieve unnecessary records.
API Connection
If your data comes from an API, the dashboard can request updated information at the configured interval.
A typical process includes:
- Send a request to the API.
- Authenticate using the required credentials.
- Retrieve the response.
- Validate the returned data.
- Update dashboard metrics.
- Display the latest successful update time.
For production dashboards, handle API errors and rate limits carefully.
If an API temporarily fails, the dashboard should avoid replacing valid displayed data with an empty result without explanation.
Step 8: Add a Last Updated Timestamp
Users should know when dashboard information was last updated.
A timestamp helps distinguish fresh data from information that may be delayed.
For example:
Last successful update: 10:30 AM
If the scheduled refresh fails, display the last successful update rather than showing the current time as though new data was retrieved.
You can also display:
- Refresh status
- Data source status
- Last successful refresh
- Next scheduled refresh
- Error messages
These details make the dashboard more transparent and easier to troubleshoot.
Step 9: Handle Refresh Errors and Data Delays
Scheduled refresh does not guarantee that every update will succeed.
Common issues include:
API Rate Limits
Some APIs limit how frequently applications can retrieve information.
If the dashboard requests data too often, the API may reject requests or temporarily restrict access.
Use an appropriate refresh interval, caching, and retry handling.
Database Performance
Frequent dashboard queries can increase database workload.
For large datasets, consider pre-aggregated tables, optimized queries, or a caching layer.
Authentication Problems
Expired credentials or incorrect permissions can prevent scheduled refresh from working.
Review connection settings and refresh logs when authentication errors occur.
Stale Data
A dashboard may refresh successfully but still display old information because the source system has not updated.
Check the source’s update frequency and data processing pipeline.
Browser Background Restrictions
Browsers may throttle timers or suspend activity in background tabs.
This means a client-side dashboard may not refresh at the exact interval when its tab is inactive.
If updates must continue reliably while users are away, schedule data processing on the server rather than relying only on a browser timer.
Step 10: Improve Dashboard Refresh Performance
A dashboard should update efficiently without creating unnecessary requests.
Use the following practices.
Retrieve Only Required Data
Avoid loading an entire database table when the dashboard needs only a few metrics.
Use filters, date ranges, and aggregation queries to reduce the amount of data transferred.
Use Caching
Caching can reduce repeated requests to databases and APIs.
For example, if several dashboard users need the same report, the application can reuse recently retrieved data instead of running the same query for every user.
Separate Data Processing From Visualization
For larger dashboards, process data independently from the visual interface.
A scheduled backend task can retrieve and prepare data. The dashboard can then display the latest processed results.
This approach can reduce loading time and help avoid repeated expensive calculations.
Choose the Right Refresh Frequency
Do not configure a one-second refresh interval simply because the dashboard is described as real-time.
Use a frequency that matches the source’s update rate and the user’s actual needs.
Scheduled Refresh vs. Automatic Page Refresh
Scheduled data refresh and automatic page refresh are different approaches.
| Feature | Scheduled Data Refresh | Automatic Page Refresh |
|---|---|---|
| Main purpose | Update data from a source | Reload or update dashboard content |
| Data retrieval | Depends on the platform and source | May or may not retrieve new data |
| Browser reload | Usually not required | May reload the page |
| Best use | Business reporting and analytics | Viewing changing webpages |
| Main limitation | Source and platform refresh limits | Browser throttling and page reload behavior |
If the dashboard already supports scheduled data refresh, a separate browser reload may not be necessary.
If the dashboard does not update its displayed content automatically, a page refresh may help, but only when the underlying application can retrieve new information after loading.
How RefreshPilot Can Help With Dashboard Monitoring
RefreshPilot is a Chrome extension designed for webpage refreshing and monitoring workflows.
It can help users automatically refresh dashboard webpages at configured intervals instead of manually reloading them.
This can be useful when:
- A dashboard does not automatically reload its webpage.
- You want to keep a dashboard page refreshed in a browser tab.
- You need to monitor webpage changes.
- You want to configure refresh intervals for browser-based workflows.
However, RefreshPilot is not a replacement for a dashboard’s database refresh schedule, backend data pipeline, or native real-time data connection.
For example, refreshing a Power BI, Tableau, or custom dashboard webpage does not guarantee that its data source has refreshed.
The dashboard itself must support retrieving updated data.
For reliable business reporting, configure the data refresh within the dashboard platform first. Use browser refresh as a complementary option when the webpage needs to reload to display updated content.
Best Practices for Creating a Real-Time Dashboard
Follow these practices when building your dashboard:
- Define the business questions before choosing metrics.
- Select a dashboard platform that supports your data sources.
- Confirm the source data update frequency.
- Configure an appropriate scheduled refresh interval.
- Use optimized queries and avoid unnecessary data retrieval.
- Display the last successful update timestamp.
- Monitor refresh failures and API limits.
- Test the dashboard with real data.
- Avoid relying exclusively on browser timers for critical updates.
- Review refresh performance as data volume increases.
A good dashboard should provide useful information consistently, not simply refresh as frequently as possible.
Conclusion
Creating a real-time dashboard with scheduled refresh requires the right combination of data sources, visualization tools, refresh settings, and performance optimization.
Start by defining the metrics users need to monitor. Connect reliable data sources, build a clear dashboard layout, and configure a refresh interval that matches the source’s update frequency.
For custom dashboards, Python Dash provides a practical way to schedule updates through callbacks. For business reporting, platforms such as Power BI, Tableau, and Looker Studio offer dashboard and data-refresh features based on their supported connections.
Most importantly, remember that refreshing a dashboard webpage is not the same as refreshing its underlying data. Configure the data source and dashboard update process correctly so users can view information that is both current and reliable.
RefreshPilot can complement this workflow by helping users automatically refresh and monitor dashboard webpages in Chrome, while the dashboard platform remains responsible for retrieving and processing the data.
Frequently Asked Questions
How do I make a dashboard update automatically?
Use the dashboard platform’s scheduled refresh settings or configure an automatic update mechanism in your application. The correct method depends on the data source and dashboard tool.
What is the best refresh interval for a real-time dashboard?
There is no universal best interval. A dashboard may refresh every few seconds, every minute, or every hour depending on the source, platform limits, and business requirements.
Does refreshing a dashboard webpage update its data?
Not always. A browser refresh reloads the webpage, but the dashboard may still display cached or previously processed data. The underlying data source must also provide updated information.
Can I create a real-time dashboard using Python?
Yes. Python frameworks such as Dash can create interactive dashboards with scheduled callbacks. You can connect them to APIs, databases, or other data sources and update components at configured intervals.
Can dashboards refresh while the browser is closed?
Some dashboard platforms support scheduled data refresh through their backend services, so data processing can continue without an open browser. However, a client-side dashboard or browser timer generally cannot continue running normally after its browser session closes.
Why is my dashboard showing outdated data?
Possible causes include a failed refresh, delayed source data, expired credentials, caching, API limits, or a dashboard refresh schedule that runs less frequently than expected. Check the refresh history, source update time, and connection settings to identify the issue.
Is scheduled refresh the same as real-time data?
No. Scheduled refresh updates information at predefined intervals. Real-time systems aim to process or deliver new information as it becomes available. The actual freshness depends on the complete data pipeline.
Stop checking. Start monitoring.
RefreshPilot combines Chrome auto refresh, page monitoring, keyword detection, notifications, and browser automation in one extension.